
HEY!
We are currently building the graph editor for the process view in TinkerFlow.
As you may have read in our Process Inspector, we discussed how UI drawers were developed for different steps, behaviors, and conditions. There we went into technical detail and explained how the source code itself works. Another topic was the component system described in our Component System inside TinkerFlow, which bridges scenes and TinkerFlow.
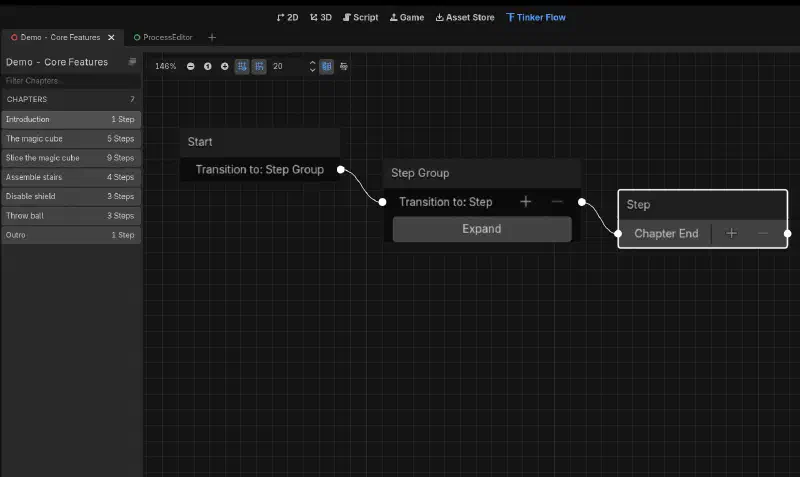
Now we are focusing on visually representing and drawing a process through the Godot graph system and showing how the parts mentioned before are connected into this system. For that we built a chapter overview with a graph system with an additional UI. The main question is to think about how to represent this visually first and how to keep the overall process readable second (the second part is the hard one…).
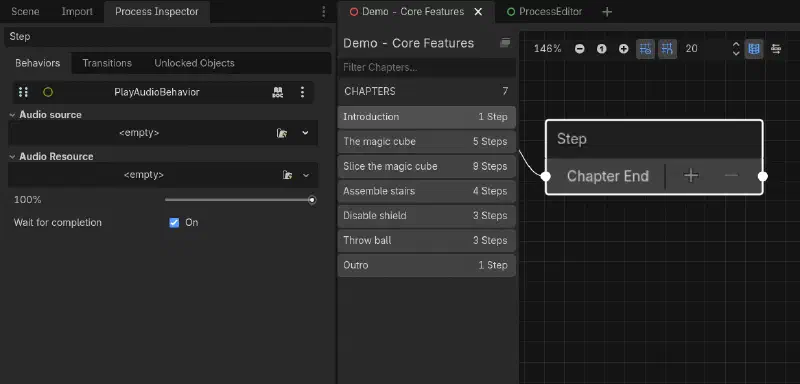
Processes and chapters#
A process is split into chapters, each chapter can hold maaaaaaany steps.
Chapters can also hold other processes or nested chapters.
Take a look at our older post about the process structure if you are curious about the process itself.
However, there are two different cases here.
A Step Group is a simple collection of steps inside a subprocess.
It keeps related steps together.
Parallel execution is the other case and is a parallel subchapter with independent paths that run side by side. When a parallel chapter runs, the parent still waits for all required paths to finish. Optional paths can be aborted until all other required paths are finished. A common use is highlighting an object while waiting for user input, or playing a delayed sound while the main process part waits.
@startuml
tinkerflow-theme

[Process] --> [Chapter]
[Chapter] --> [Step]
[Step] --> [Transition]
[Step] --> [Behavior]
[Transition] --> [Condition]

[StepGroup : single nested chapter] --> [Chapter]
[Parallel : multiple subchapters] --> [Chapter]

@enduml
Developers can see this in ExecuteChaptersBehavior.Update.
It waits until every non-optional subchapter reaches Active, then it aborts the optional ones that are still in Activating.
// ExecuteChaptersBehavior: wait for required paths, then abort optional ones
while (Data.SubChapters.Any(sc => sc.IsOptional == false && sc.Chapter.LifeCycle.Stage != Stage.Active))
{
    foreach (SubChapter sc in Data.SubChapters.Where(sc => sc.Chapter.LifeCycle.Stage == Stage.Activating))
    {
        sc.Chapter.Update(); // keep required paths ticking
    }
    yield return null;
}
foreach (SubChapter subChapter in Data.SubChapters.Where(sc => sc.IsOptional && sc.Chapter.LifeCycle.Stage == Stage.Activating))
{
    subChapter.Chapter.LifeCycle.Abort();
}
Nodes in the graph view#
Right now this builds on native Godot elements with custom code.
We reuse Godot components where possible.
The editor window combines ProcessEditor with ChaptersView, Breadcrumb, and StepWindow.
The ChaptersView shows which level you are on, the main chapter or a nested one.
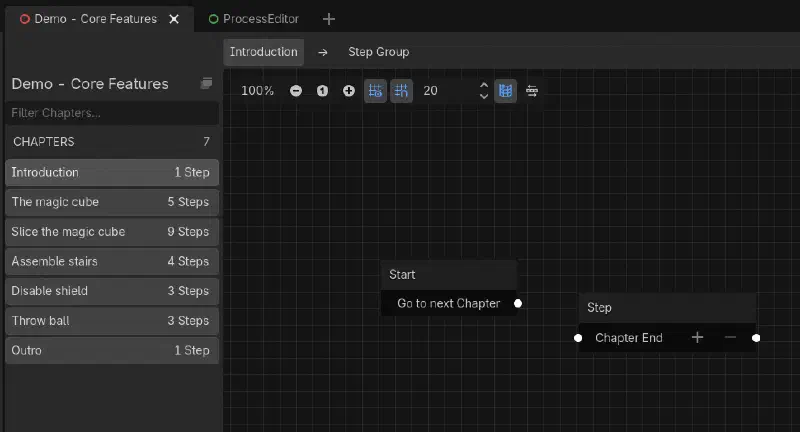
Every chapter has a start and an end node, plus as normal steps as you need.
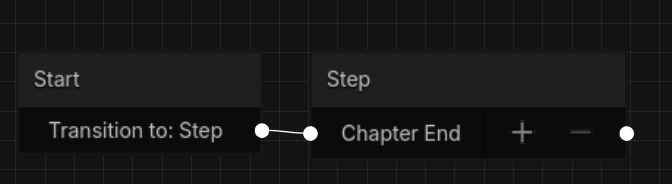
A normal step starts with one input and output.
It grows to N rows for N transitions, so a step with three transitions shows three rows with three output ports.
The End Chapter node can jump to other chapters.
Its dropdown shows the label “Next chapter selection is not implemented yet”, so picking a target chapter stays an idea for now.
The start step is the entry point of the chapter or process, with a pointer going outward.
All of this happens at editor time. Bringing the full graph view into runtime would be technically possible (and this is interesting for a lot of use-cases!).
TinkerFlow nodes and Godot connection#
On the Godot side GraphEdit, GraphNode are the main class for the graph system.
In TinkerFlow those map to concrete classes.
ProcessGraph is the GraphEdit that handles connections, layout, and dirty tracking.
GraphNodes plus StepNodeRow implement the visible elements like start and end nodes, group nodes, and parallel nodes.
ProcessEditor with ChaptersView, Breadcrumb, and StepWindow render the full window so you see a clean editor.
Position saving is a good example.
When you drag a node, ProcessGraph writes the new position back to metadata and marks the graph modified.
// ProcessGraph: keep node position in metadata
node.EntryPoint = step;
if (step.StepMetadata.Position != null)
    node.PositionOffset = step.StepMetadata.Position.ToGodot();
node.PositionOffsetChanged += () =>
{
    // save every drag so reopening restores layout
    step.StepMetadata.Position = node.PositionOffset.ToVector2Data();
    OnModified();
};
All graph nodes inherit from a shared ProcessGraphNode, which itself extends Godot GraphNode.
StepGraphNode adds step data, rows, and ports on top of it. StepGroupNode adds the Expand button for drilling into a nested chapter.
EntryPointNode is a direct child of ProcessGraphNode. It does not go through StepGraphNode, because it has no step data or transitions.
@startuml
tinkerflow-theme

[GraphNode] <-- [ProcessGraphNode]
[ProcessGraphNode] <-- [StepGraphNode]
[ProcessGraphNode] <-- [EntryPointNode]
[StepGraphNode] <-- [StepGroupNode]
[StepGraphNode] <-- [EndChapterNode]

@enduml
From click to inspector#
The Process Inspector is part of the editor element.
Clicking a node selects the step in ProcessGraph.
ProcessEditor forwards it to StepWindow.
StepWindow asks DrawerLocator for the matching factory, as described in the inspector post.
Speaking of UI redrawn and optimization.
The graph itself refreshes through a Dirty flag, so only changed nodes redraw.
@startuml
tinkerflow-theme

actor User
[ProcessGraph] as Graph
[ProcessEditor] as Editor
[StepWindow] as Inspector
[DrawerLocator] as Locator

User -down-> Graph : click step node
Graph -left-> Editor : OnStepSelected
Editor --> Inspector : show step
Inspector --> Locator : factory for type
Locator --> Editor : return drawer
Graph -down-> Graph : Dirty Refresh in _Process

@enduml
Future ideas for the graph view#
We have tons of ideas for the whole graph view and system here. Nothing is scheduled, and order will depend on feedback.
One idea is stronger visual feedback while the app runs. The active path could use color coding, so you see at once which step is active and where the process heads next. A green border could mark the active step.
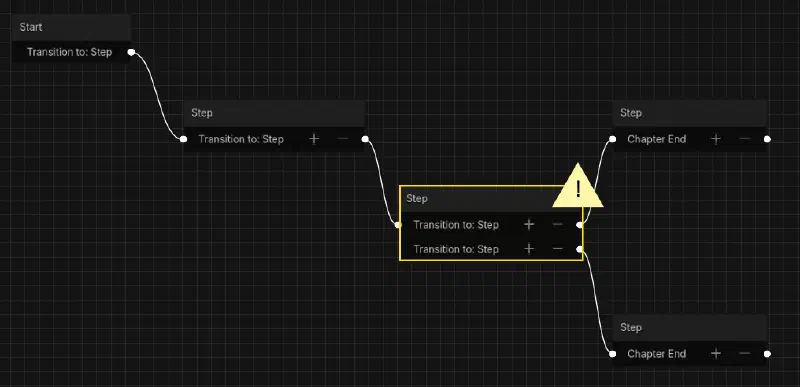
A missing behavior could show a warning triangle or a red mark, so validation errors show in the graph instead of only in logs. Or using icons for the different types of behaviors and nodes is also an option.
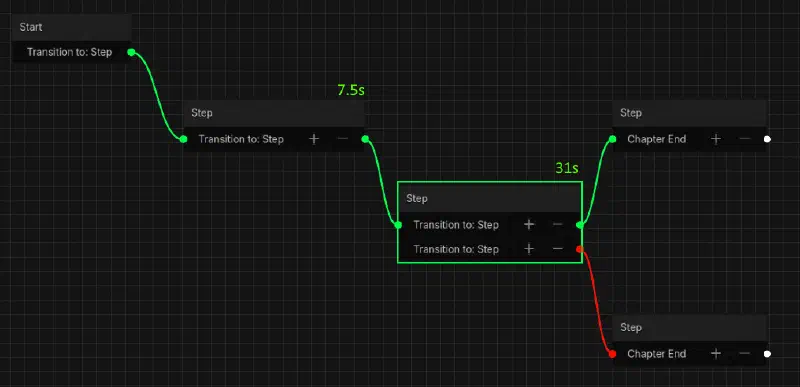
For analytics reasons the visual most likely path is interesting. Based on pre-existing data or live evaluation while the application is running.
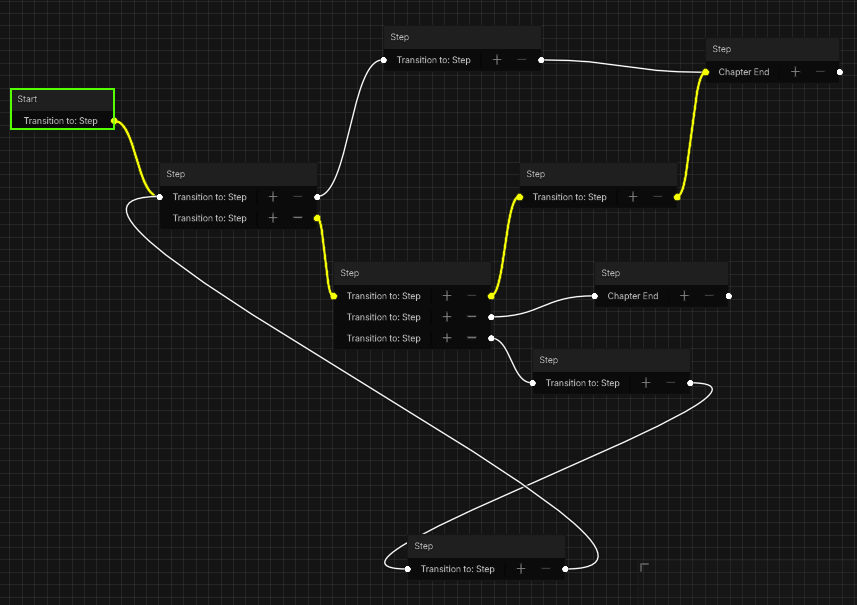
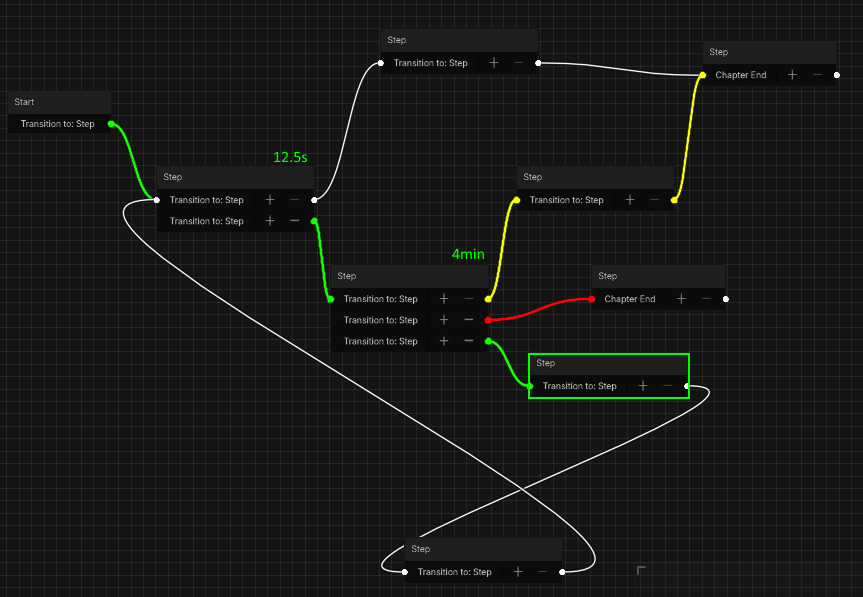
A second idea is a cleaner layout. Steps could snap to a self-aligned grid. Edges could use angular lines instead of curves. This placement could try to reduce crossings. Godot already gives us good building blocks for this, so we would add it case by case.
A third area are additional graph elements like swimlanes inspired by BPMN or notes.
Swimlanes could group steps by role, which helps in multiplayer setups or role mapping.
Both stay low level in TinkerFlow.
We borrow the visual idea without copying the full notation.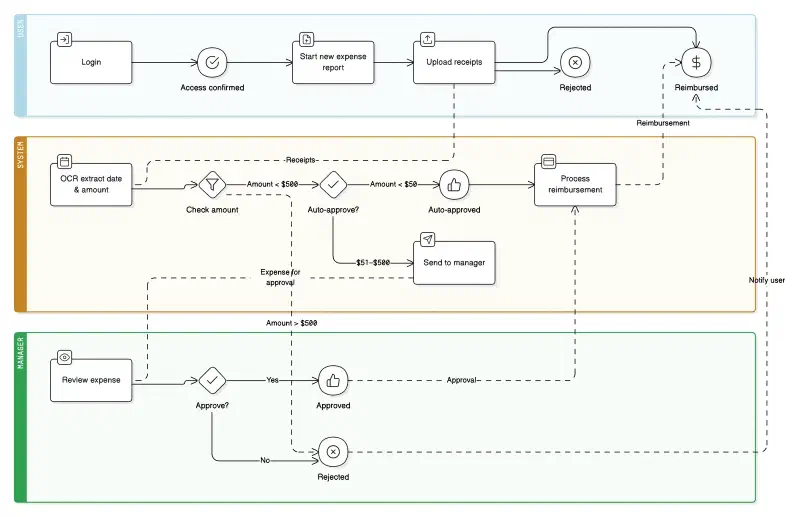
Notes would hold comments directly in the graph like here: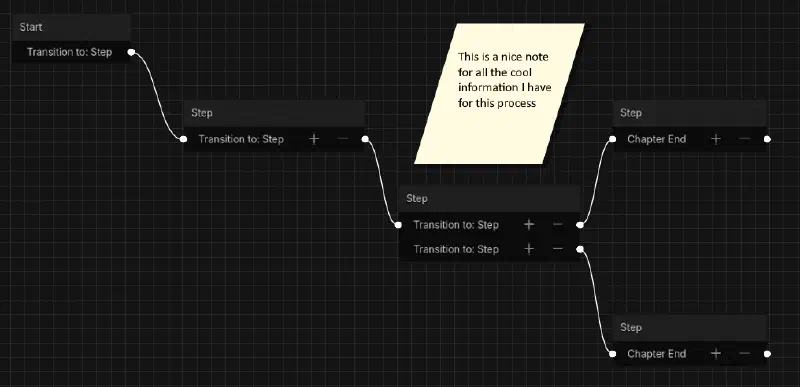
Navigation across levels already has a working core through Expand and the breadcrumb. The remaining work is polish, like faster jumps between nested layers and a calmer presentation of depth.
All these kinds of additional data are saved as metadata inside the process data and process.json file.
BUT, currently, we focus on getting the core to work well. Once that is solid, extensions like the ones above can follow. At this point we are very satisfied with what Godot graphs give us out of the box.
We hope you enjoyed this blog post, see you next time!